Kiko
| You are here: Kiko > ExcelStuff > AFewKindsOfClocks | Printable | topic end |
Start of topic | Skip to actions
| Versão em Português |
A Few Kinds of Clocks
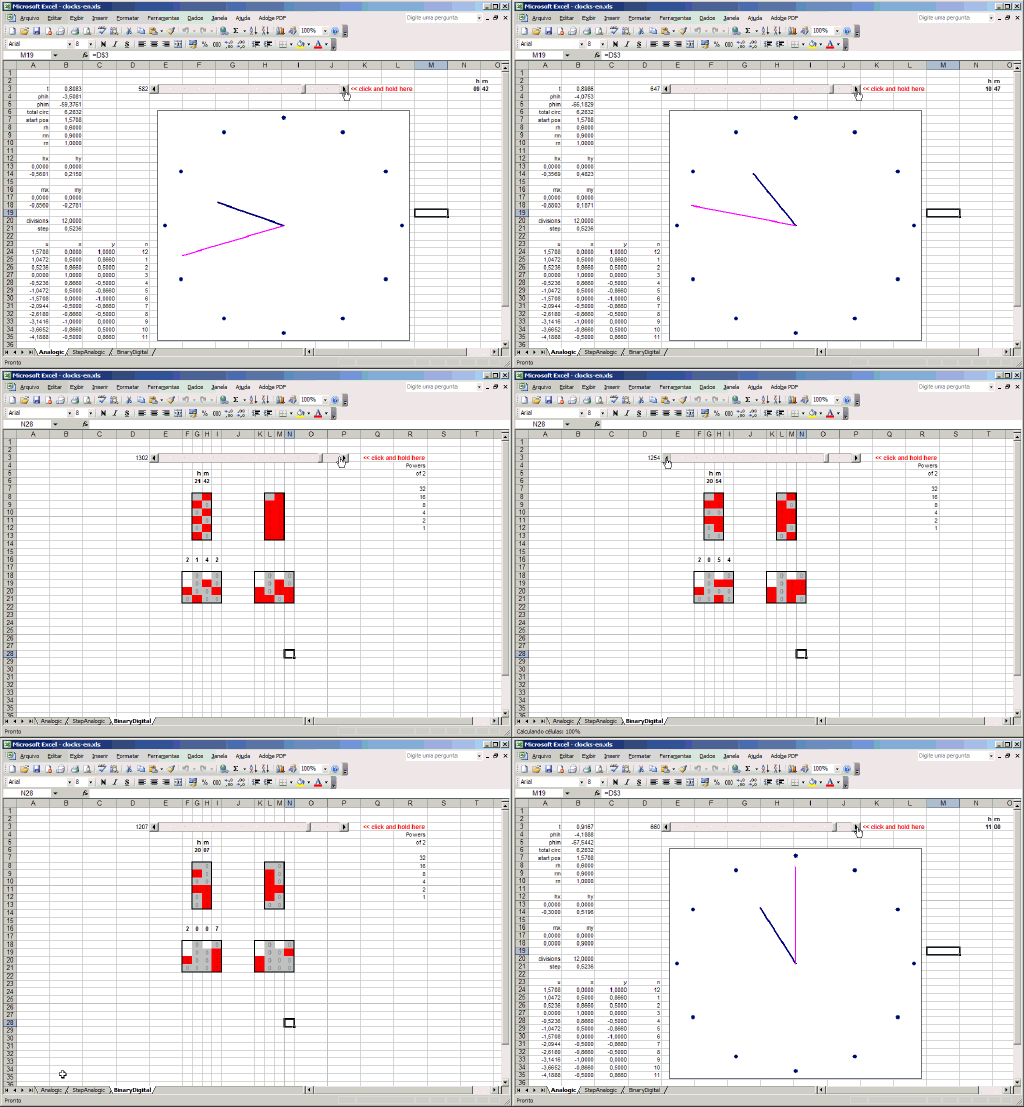
Two analog clocks simulated in Excel graphs along with two digital clocks directly in the worksheet -- one in standard binary order and another in binary reflected gray code.
Click on the image to download the workbook
Real Life Version
I built a real life version of the BCD clock in hardware using LEDs and a microcontroller. It makes a nice display in my living room.Mini-FAQ
Q1. How do you make the scrollbars change the cells' values? Is that some hidden VBA code?
A1. No. Actually, I think that the beauty of it is that there's no VBA code at all. In fact, having scrollbars or other form-like controls change the values of some cells has been a standard (yet surprisingly little known) Excel feature for many years. Here's how you use it: right-click any toolbar icon -- a pop-up menu will let you choose other toolbars. Left-click on the "Form" option; this will show the (normally hidden) "Form" toolbar. There you can select several controls, including the scrollbars: click on the appropriate control icon and the mouse cursor will turn to a thin cross. Drag and drop a rectangle on the worksheet and a control with that size will appear. Right-click it with to get the context menu and ask for the "Format control" option. A dialog box will appear that allows you to define the control's maximum an minimum values, increments, and, most importantly, which cell it is linked to. As soon as you link a control to a cell, anytime you click on that control, causing it to change its value, will trigger a recalculation (assuming automatic recalculation is globally enabled, which it probably is, since it's the default). If some graph depends on values that ultimately depend on some cell linked to that control, it will be redrawn as well. In Excel versions 2003 and above, it is useful to surround the graph with cell values that change to force it to be contained in the bounding box that will be updated. Otherwise, the graph will be only partially redrawn (or not at all!) at every value change, making animations become visually ugly. Incidentally, OpenOffice has a similar feature that works almost exactly the same way, but the graph refresh takes seconds, making it way too sluggish for animations. Besides, OO's graphing capabilities lag far behind Excel's -- I have no idea why OO's XY graphs still don't support something as simple as non-ordered X values. That's the reason I don't make avaliable OO versions of this worksheet.Q2. Why don't you add a seconds hand?
A2. Excel scrollbars yield values from 0 to 30,000 only, and there are 43,200 seconds in a half-day. Workarounds exist, but they are very unelegant. I wanted to keep it simple.top
